


Opt-in previews of new features for Pro and Personal subscribers. Try them, tell us what works.
What is Labs? Features that we think are useful and ready for real-world testing, but haven't graduated to the main interface yet. Some are visual polish; others are bigger product bets. All are off by default and can be toggled per-account.
Labs features may change, regress, or be retired without notice. We won't break paid subscriptions over them, but we will iterate fast. The trade-off for tolerating rough edges is early access and a direct line to shape the feature — tell us what you think.
Who can use it? Active Pro and Personal subscribers. If your subscription lapses, your Labs flags stay set but the features turn off — re-subscribe and they come back.

Adds a 'Motion Trail' slider to SD radar pages (/radar/IDR…). Drag it to leave a decaying trail of recent frames behind the current one. The further right you drag, the longer the trail. Particularly useful when paused or moving slowly through frames — you can see where cells came from without having to replay the loop.
Sign in to enable. Registered required to opt in.

Explore past Australian weather events on a map. Choose an area and date range, then select the layers you need: gauge rainfall with radar context, wind and temperature observations, river levels, warnings, and historical forecasts. Results depend on the records held for your selection. Save a rewind to return to it or share a read-only view. Download options vary by layer. Weather Rewind is in beta, so some sources or dates may have gaps.
Sign in to enable. Pro only required to opt in.

Adds a bookmarkable meteogram page at /<state>/<place>/meteogram for every location (eg /vic/melbourne/meteogram), plus a point lookup on the forecast map (long-press to drop a flag, then 'View meteogram'). Stacks up to seven NWP models on the same time axis with synchronised zoom and an ensemble mean/spread tooltip. Personal tier sees ADFD + ECMWF + GFS over 7 days; Pro sees all seven models out to 14 days.
Sign in to enable. Personal or Pro required to opt in.

Adds an 'Animate observations with timeline' checkbox to the live map. When ticked, the temperature, rainfall, river-height and wind markers re-paint to show each station's reading at the timestamp of the current radar/satellite frame, instead of always displaying the latest value. Loads about an hour of recent observations in one go so scrubbing the slider feels instant. Rainfall stays monotonic across the loop: AWS shows running-since-9am, rain gauges and DPIRD stations show the cumulative within the visible window. Currently in beta — back-port to the HD radar pages is planned once we've shaken bugs out here.
Sign in to enable. Registered required to opt in.

Adds +1h and +2h buttons to the live map's player controls. Turn one on and the radar animation keeps playing past the current time into a national rain forecast, built from where the rain is now and how it's moving. It refreshes itself as new radar arrives, and switches off on its own when there isn't enough rain around to forecast. Indicative only, and not suitable for safety or emergency decisions.
Sign in to enable. Registered required to opt in.

Smooths the wind direction markers on the live map. With it on, each wind barb eases around to its new heading along the shortest arc rather than jumping, so the wind layer no longer flaps frame-to-frame during animation playback or on the periodic live update. Looks best paired with Animated Observations, but also tidies the regular 10-minute refreshes. Purely a visual effect — it interpolates between the actual reported directions and doesn't change the underlying data.
Sign in to enable. Registered required to opt in.
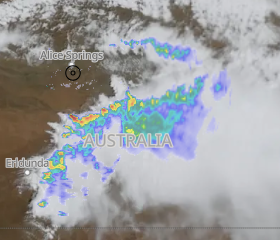
Adds a radar opacity slider beside the layers on the live map. Drag it left to fade the rain radar and see more of the satellite picture or land underneath. The setting applies while the animation plays and resets when you reload the page.
Sign in to enable. Registered required to opt in.
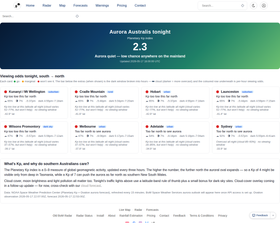
Adds a per-city traffic-light viewing verdict (green/amber/red) for the Aurora Australis at /aurora, plus a focus-mode page for any Australian lat/lon (a small status pill also appears on location pages south of -32°). Pulls live NOAA Planetary Kp, DSCOVR solar-wind Bz, the 3-day Kp forecast, NOAA Ovation oval, BoM ADFD cloud cover and astronomical sun/moon times into a single dark-window plan.
Focus mode shows a horizontal 3:1 Kp/cloud/Bz/verdict timeline through the night with a per-component breakdown of what's driving the verdict, and Pushover alerts fire automatically when planetary Kp crosses storm and severe thresholds.
Sign in to enable. Registered required to opt in.
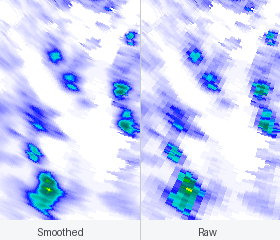
Adds a 'Raw radar (no smoothing)' switch to the HD radar pages (/radar/bom/…) when viewing reflectivity. Normally each frame is interpolated so the imagery looks continuous between the radar's native samples. With this switch on, every radar sample is drawn as its own cell with no blending, so you see the data exactly as measured, at its true resolution: sharper and blockier, with the beam spreading visibly wider further from the radar. Useful for judging how much detail the radar really captured, and for spotting artefacts that smoothing can hide. Reflectivity only; the choice is remembered across visits.
Sign in to enable. Personal or Pro required to opt in.

Adds a 'Colour Scale' selector to the forecast map sidebar. For whichever parameter you're viewing (temperature, rain, wind, cloud and so on) you can switch between several built-in colour schemes, from BoM-style defaults to vivid, muted, and perceptually-uniform palettes. Your chosen scheme applies per parameter for the current session.
Sign in to enable. Registered required to opt in.

Adds a 'Value filter' to the forecast map sidebar with Min and Max sliders. Anything outside the range you set is hidden, so you can isolate (for example) just the heavy-rain areas or a single temperature band. Turning this on also switches the map to GPU-accelerated colour rendering, so colour-scheme and filter changes update more smoothly. Experimental: it needs a recent browser, and quietly falls back to the standard rendering if that isn't available.
Sign in to enable. Registered required to opt in.

Adds a 'Discrete colours' switch to the forecast map sidebar. Instead of blending smoothly between colours, each value snaps to the nearest step on the scale and the whole step is painted one flat colour, so you can match an area on the map straight to the legend and read off an approximate value. You can switch it on or off separately for each parameter (temperature, rain, wind, cloud and so on), and your choice is remembered next time you visit.
Sign in to enable. Registered required to opt in.
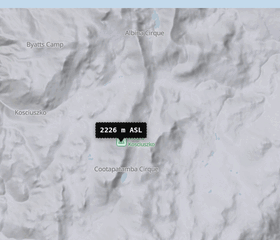
Adds a 'Ground height' switch to the map layers on the national map and the HD radar pages. With it on, a small label follows the mouse pointer showing the height of the land under it, in metres above sea level. Useful for judging whether a shower is running up into a range, how much fall there is along a valley, or how high the country is under a storm. The heights come from the same elevation data these maps already use to draw hillshading and contour lines. It needs a mouse to point with, so the switch is not offered on a phone or tablet.
Sign in to enable. Registered required to opt in.
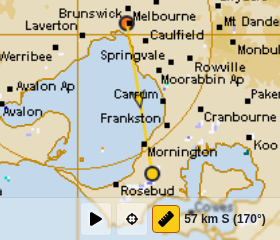
Adds a Measure button to the national map, HD radar and SD radar. Tap or click two places to see the distance in kilometres and the direction from the first to the second. When your location is showing, one tap measures from you to the place you choose.
Sign in to enable. Registered required to opt in.
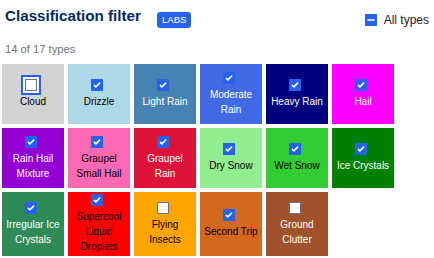
Adds a type filter to the Classification view on HD radar pages. Leave all types ticked for the standard view, show only the hail family during a storm, or hide flying insects and ground clutter when they obscure the weather. Changing the selection takes effect straight away, downloads nothing extra, and works on past frames as well as the latest ones.
Sign in to enable. Registered required to opt in.
Sign in or create an account to opt into Labs features. Some Labs are open to any registered account, others require a Personal or Pro subscription — see the badge next to each feature above.


 Dark mode
 Light mode